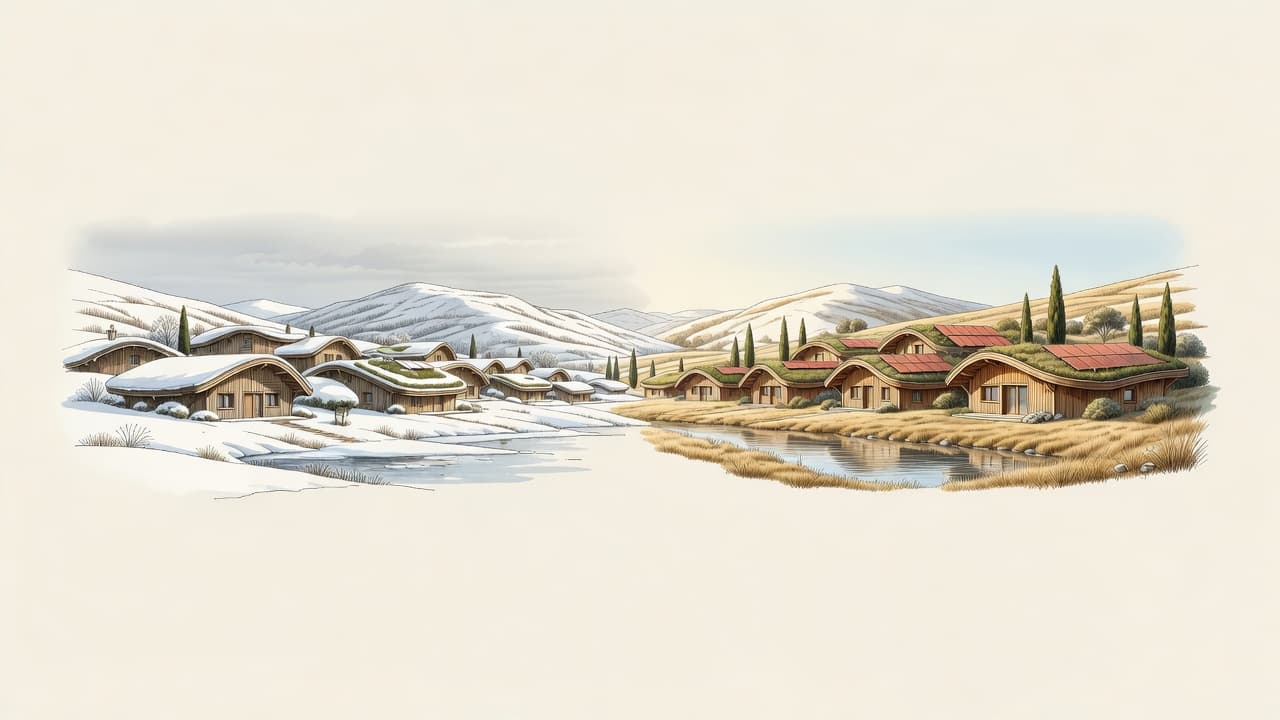
The winter wall drops off the Alps
Exactly the same neighbourhood, computed at five European locations: Breda, Ghent and Munich share the same winter wall and the same harshest year (2010), but south of the Alps the wall collapses. In Milan the neighbourhood earns money up to 80%; in Palermo 90% self-sufficiency costs 68 euros per home per year, without seasonal storage.
One neighbourhood, five places
Image above: AI impression, not a construction drawing.
The question came out of a conversation about a second community in another country, and it turned out sharper than it sounded: is the winter wall a Dutch peculiarity, or a law of nature? I answered it with the cleanest experiment I could think of: exactly the same neighbourhood, with the same behaviour, the same roofs and the same heat pumps, computed at five places between Breda and Palermo. Everything stays the same except the weather. Fifteen real weather years per place, satellite data, and for each place the winter deficit: the energy storage has to bridge in winter.
The five places: Breda, Ghent, Munich, Milan, Palermo. Two hypotheses up front: the wall gets gradually lower as you go south, and Milan will be a surprise on the high side, because the winter fog of the Po valley is notorious.
Both hypotheses fell
The wall does not get gradually lower. It drops off the Alps in one step.
Breda, Ghent and Munich sit within 15% of each other, with a median winter deficit of 3.0 to 3.4 MWh. Munich is the most instructive of the three: three and a half degrees south of Breda and 14% more solar yield, but a quarter more winter cold thanks to the continental climate. Sun and cold cancel out. The winter wall does not follow latitude but the balance between winter light and winter demand.
And Milan? A quarter of Breda's deficit. My fog story was a good story, and a good story is not yet a good number: the Italian winter light comfortably beats the haze. Palermo finishes it off with a deficit of 241 kWh, one fourteenth of Breda. Across fifteen years, the harshest Sicilian winter never exceeds 468 kWh. That is not a seasonal problem any more; that is one long dark week.
What it costs, per place
Then I had the model size the neighbourhood again for each place, robustly across the three harshest weather years of that place itself, with local exchange prices. Net annual cost per home at 90% self-sufficiency:
- Breda: € 12,089 per home per year, with a seasonal store of nearly 12 MWh.
- Ghent and Munich: comparable, € 10,798 and € 11,742, with almost identical stores. The northwest is one climate zone.
- Milan: € 3,134, a quarter of Breda, with a store of just 2.8 MWh. And up to 80% self-sufficiency the Milanese neighbourhood earns money on its system.
- Palermo: € 68. Sixty-eight euros per home per year, without a single kilowatt-hour of seasonal storage. The curve that is a wall in Breda is a flat line on Sicily.
One more detail completes the story: the three northwestern places all share the same harshest year, 2010. The cold winter that broke my robust sizing was not a Dutch accident but a Northwest-European event. South of the Alps a different weather regime applies, with a different harshest year. Robustness windows are regional.
What this means
For the Netherlands the message does not change, except that it stands firmer: the winter wall here is a structural feature, shared with Belgium and Germany, and whoever wants around it has to go via the ambition or via seasonal storage.
For the idea of a second community elsewhere, the story gets richer. In Flanders the climate is identical to Breda, but people have lived without net metering for five years: what awaits the Netherlands in 2027 is simply measurable history there. And in Italy, with the most subsidised energy-community market in Europe, physics is suddenly not the bottleneck. A neighbourhood in Milan with a seasonal store the size of two large community batteries, or a neighbourhood on Sicily that is 90% self-sufficient for the price of an insurance premium: there the question is not whether it can be done, but why it is not happening yet.
The whole ladder is now on the explorer, below the main curve, with a button per place. Go and see what your favourite place does.
What this rests on
- The ladder uses the Dutch demand profile and Dutch new-build heat parameters everywhere. That is the point (everything the same except the weather), but it means: this is the climate comparison, not the country comparison.
- Cooling is not in the model. South of the Alps the winter wall disappears, but what comes back in its place, the summer cooling peak, I do not compute yet. Palermo's real design question is probably the summer. That is the next model layer, and until it exists, the Sicilian story is half a story.
- The ladder runs on satellite weather (PVGIS). For Breda that source computes 6 to 21% more favourably than the KNMI ground station the rest of the lab runs on; all ladder figures are mutually comparable, but not with the explorer's main curve. Whoever sizes on satellite data calculates themselves richer than the ground station measures. That too is a finding.
- For Munich no usable exchange prices were available (the data source kept failing); that cost figure is more indicative than the other four.
- The full report, with all fifteen year tables per place, is in the lab repository.