Simulation lab · Breda, NL · 8 to 40 households
Solarpunk, with the math done.
SolarPunkLab is a living simulation of a self-sufficient neighbourhood: energy, water and community in one balance model that closes every tick. Read what actually works, what does not, and what it costs. Built on real Dutch weather years, with every assumption labelled and every number open to attack.
Read the lab log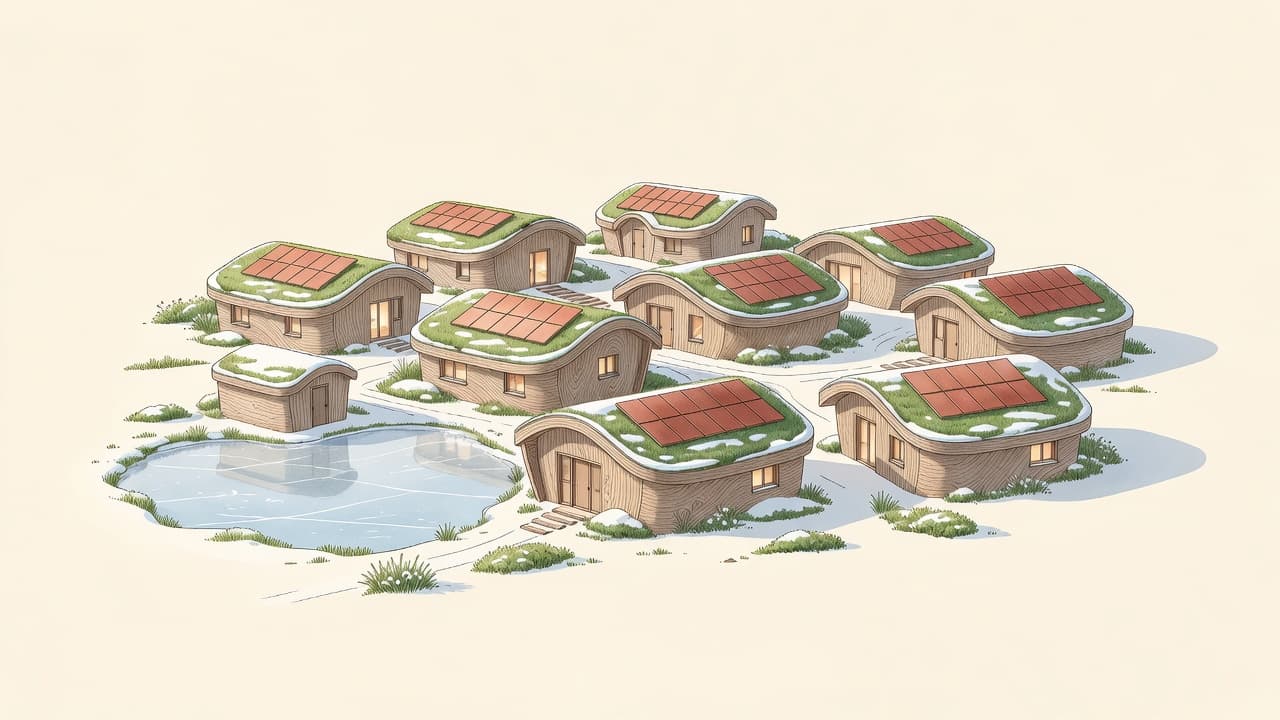
Four numbers from the lab
Seasonal storage breaks the winter wall: 90% self-sufficiency including heat drops from 117,000 to 12,900 euros per year.
LP run · base-8 + heat · weather year 2022 · A48: low confidence
The earliest crossover year in which building new becomes cheaper than renovating, under aggressive construction automation.
K series · aggressive automation · without automation: ±2054
The ceiling on rainwater self-sufficiency. Bigger tanks do not help; the ceiling sits in the greywater split.
greywater ceiling 36.8% · 2018 drought · daily profile A28
What a free rider draws from the shared neighbourhood battery each year under an open pool. The right sharing rules cut that in half, or reverse it.
open pool · pro-rata rule: +204 · archetypes A32 to A34
✓ Balance closed · every number above comes from runs whose hourly energy balance closes to machine precision
Why this lab
I want this future so badly that I do not trust myself
That is really all it is. When you believe in something hard enough, you start fooling yourself. Suddenly every calculation works out. Suddenly every article points your way. I know that about myself. So I built something that does not play along.
The lab is a rebuilt neighbourhood. Eight to forty households, anchored in Breda, the Netherlands. Real weather from the Dutch met office, real consumption profiles, and one hard rule: the energy balance has to close every hour. Not roughly. To machine precision. If a result looks too good, there is a mistake in there, and I go find it.
You are welcome to love the dream images on this site. Just do not believe them on sight. Under every image sits a number, and under every number an assumption you can check yourself. Go check it. Attack it. That is how the lab gets better.
The model
Three layers, one balance model
Everything is connected: the heat pump drives winter demand, the water profile feeds hot-water heat, the sharing rules decide who drains the battery. So the lab computes them together, not in separate single-purpose tools.
Energy
Solar on every roof, a shared neighbourhood battery, dynamic prices, heat pumps and seasonal storage. Computed hour by hour; a full year runs in a tenth of a second.
Water
Rain harvesting, retention and greywater splitting, stress-tested on the real 2018 drought. Including sewer overflow during cloudbursts, the number municipalities actually plan around.
Community and governance
Simulated households and three Ostrom rule sets side by side. Behaviour changes demand, rules change distribution; the lab keeps those two strictly apart.
The crossover model
When does building new become cheaper than renovating? The starting condition is that renovation wins today, in line with the evidence. If you find a crossover, you set the assumptions yourself and you can defend them.
First the contract, then the numbers
Every number on this site is bound by an honesty contract: assumptions labelled with source and confidence, starting conditions that work against the vision, and balances that close. Read how that works before you believe any of the results.
Read the honesty contract