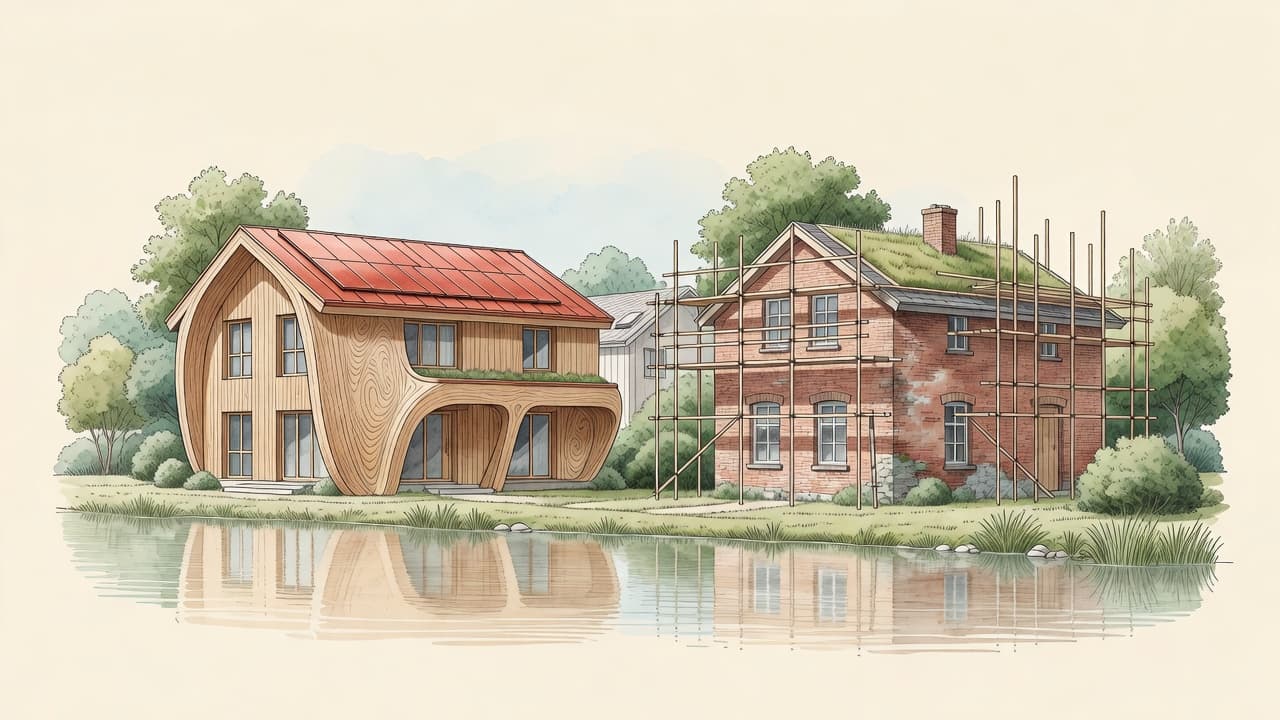
The crossover model: when does building new become cheaper than renovating?
In the model, the costs of building new and renovating cross somewhere between 2039 and 2054. Around 2039 under aggressive construction automation, around 2043 moderate, and even without automation around 2054 on the rising grid-cost path. The starting condition is deliberately that renovation wins today; if you find a crossover, you set the assumption about construction automation yourself.
The instrument that can take down my own vision
Image above: AI impression, not a construction drawing.
This is the piece in the lab I was most uncertain about, and precisely for that reason the most important. The core vision behind this whole project is that, in time, building new beats renovating forever. But a vision you cannot disprove is not a vision, it is a belief. So I built the instrument that can shoot down my own conviction: the crossover model.
It runs on an unfair starting position, deliberately against myself. The test suite enforces that renovating is cheaper than building new today, because that is what the peer-reviewed evidence says. So I start from the conclusion that contradicts my vision. The question is not whether I turn out to be right. The question is: under which assumptions do those two cost lines cross anyway, and when?
Where the lines cross
Picture two lines falling over the years. One is the cost of building new, the other of renovating. Today the renovation line sits lower. The question is whether, and when, the new-build line dives below it.
In the model it does, and the year depends on how fast construction automates itself:
- Aggressive construction automation: crossover around 2039, thirteen years from now.
- Moderate: around 2043.
- Without any automation they still cross, around 2054, purely because the grid gets more expensive (the rising grid-cost path from the Dutch regulator ACM, verified).
That last one surprised me most. Even if building gets no cheaper at all, the rising price of a grid connection eventually lifts new build below renovation. So the twenty-year vision is achievable in the model, within assumptions that sit neatly inside the range of the literature.
One dial carries almost the whole difference
The model does something else I have not seen anywhere: it shows exactly which assumption sets the year. And it is mostly one, the asymmetry dial: how fast does building something new get cheaper through automation and prefab, compared to rebuilding something that already exists?
That is not a detail to tuck away. It is the translation of a hard research finding, that renovation automates far worse than new construction, into one adjustable parameter. Turn that dial toward 2039 or toward 2054, and you watch the whole outcome move with it.
And here is the honesty: whoever finds a crossover in this model set that assumption themselves. I do not hand you a conclusion. I hand you the dial, and the duty to defend where you set it.
What this leans on
I do not pretend to know this for certain. The learning curve of construction automation, the heart of that asymmetry dial, does not exist anywhere as a hard number. I estimate it now by a detour: the analogy with mining and data from prefab factories. That is a defensible estimate, not a measurement. It is also the most honest open question of the lab.
But notice what the model does do. It does not say: building new gets cheaper. It says: if you believe building automates faster than renovating, then this year follows, and otherwise that one. It moves the discussion from vague to precise, from opinion to assumption.
That is the whole point of this lab. Do not believe my number. Turn the dial yourself, choose your own assumption, and see where you land. If you have a better estimate for that learning curve, you make the model better than I left it.